ECG- Rapid Guide
Introducción
Cardiac cycle
The electrical signals recorded on an electrocardiogram (ECG) occur before the mechanical processes of contraction and relaxation during the cardiac cycle. Each electrical event corresponds to a specific ECG deflection (wave). ECG waves correlate to specific phases of the cardiac cycle, and each complex is a sequence of deflections that represent electrical activity of the heart, measured against a baseline.
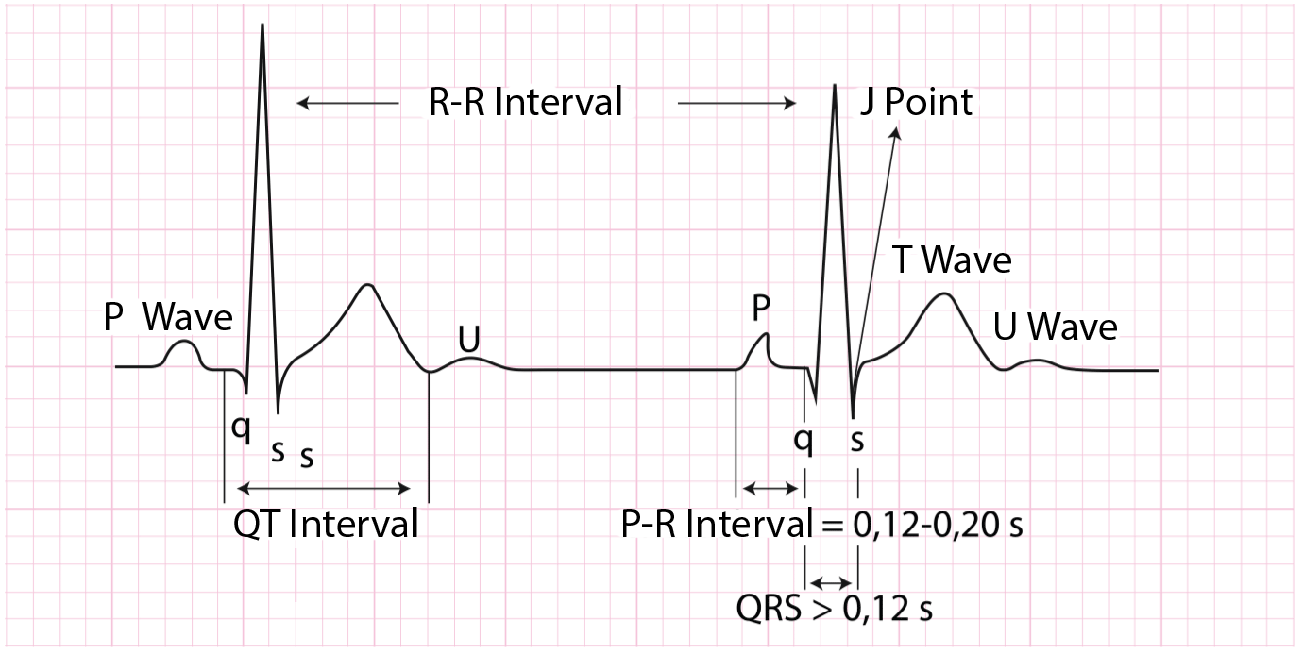
P Wave: corresponds to atrial depolarization. Less than 100ms in duration, and less than 2.5mm in amplitude. It is typically positive in most ECG leads, except for aVR, where it is negative,, while V1-V2 are variable, often biphasic (positive-negative).
QRS Complex: represents ventricular depolarization. It can present different morphologies. The duration is normally 0.06 to 0.10 seconds.It can be characterized as either positive, negative, or biphasic, based on the overall direction of the electrical activity.
T Wave: reflects ventricular repolarization. It exhibits a positive deflection, but it's a known characteristic that it is negative in lead aVR.
U Wave: represents repolarization of the papillary muscle and neighboring structures. It is a small, positive deflection, with a voltage normally < 25% of the T-wave voltaje.
R-R Interval: the time elapsed between two successive R waves. In the sinus rhythm, this interval must be constant. It allows calculation of the heart rate.
P-R Interval: reflects the time interval from start of atrial depolarization tos atar of ventricular depolarization, in order to determine whether impulse conduction from the atria to the ventricules is normal in terms of speed. A normal PR interval ranges between 0.12 seconds to 0.22 seconds.
P-R Interval: Debe ser constante y su medida depende de la frecuencia cardiaca.
ST Segment: represents the period at which both ventricles are completely depolarized. This is the isoelectric period following the QRS and ending at the beginning of the T wave. The junction between the QRS complex and the ST segment is called the J point, and it is used to identify deviations from the isoelectric line, indicating either elevation or depression. These deviations can be significant in diagnosing myocardial ischemia or infarction, and the exercise ECG interpretation.
QT Interval: Time from the start of the Q wave to the end of the T wave. Represents time taken for ventricular depolarisation and repolarisation, effectively the period of ventricular systole from ventricular isovolumetric contraction to isovolumetric relaxation.